

Home » IT Contractor » Top Tools Data Analysts Use to Analyse Data
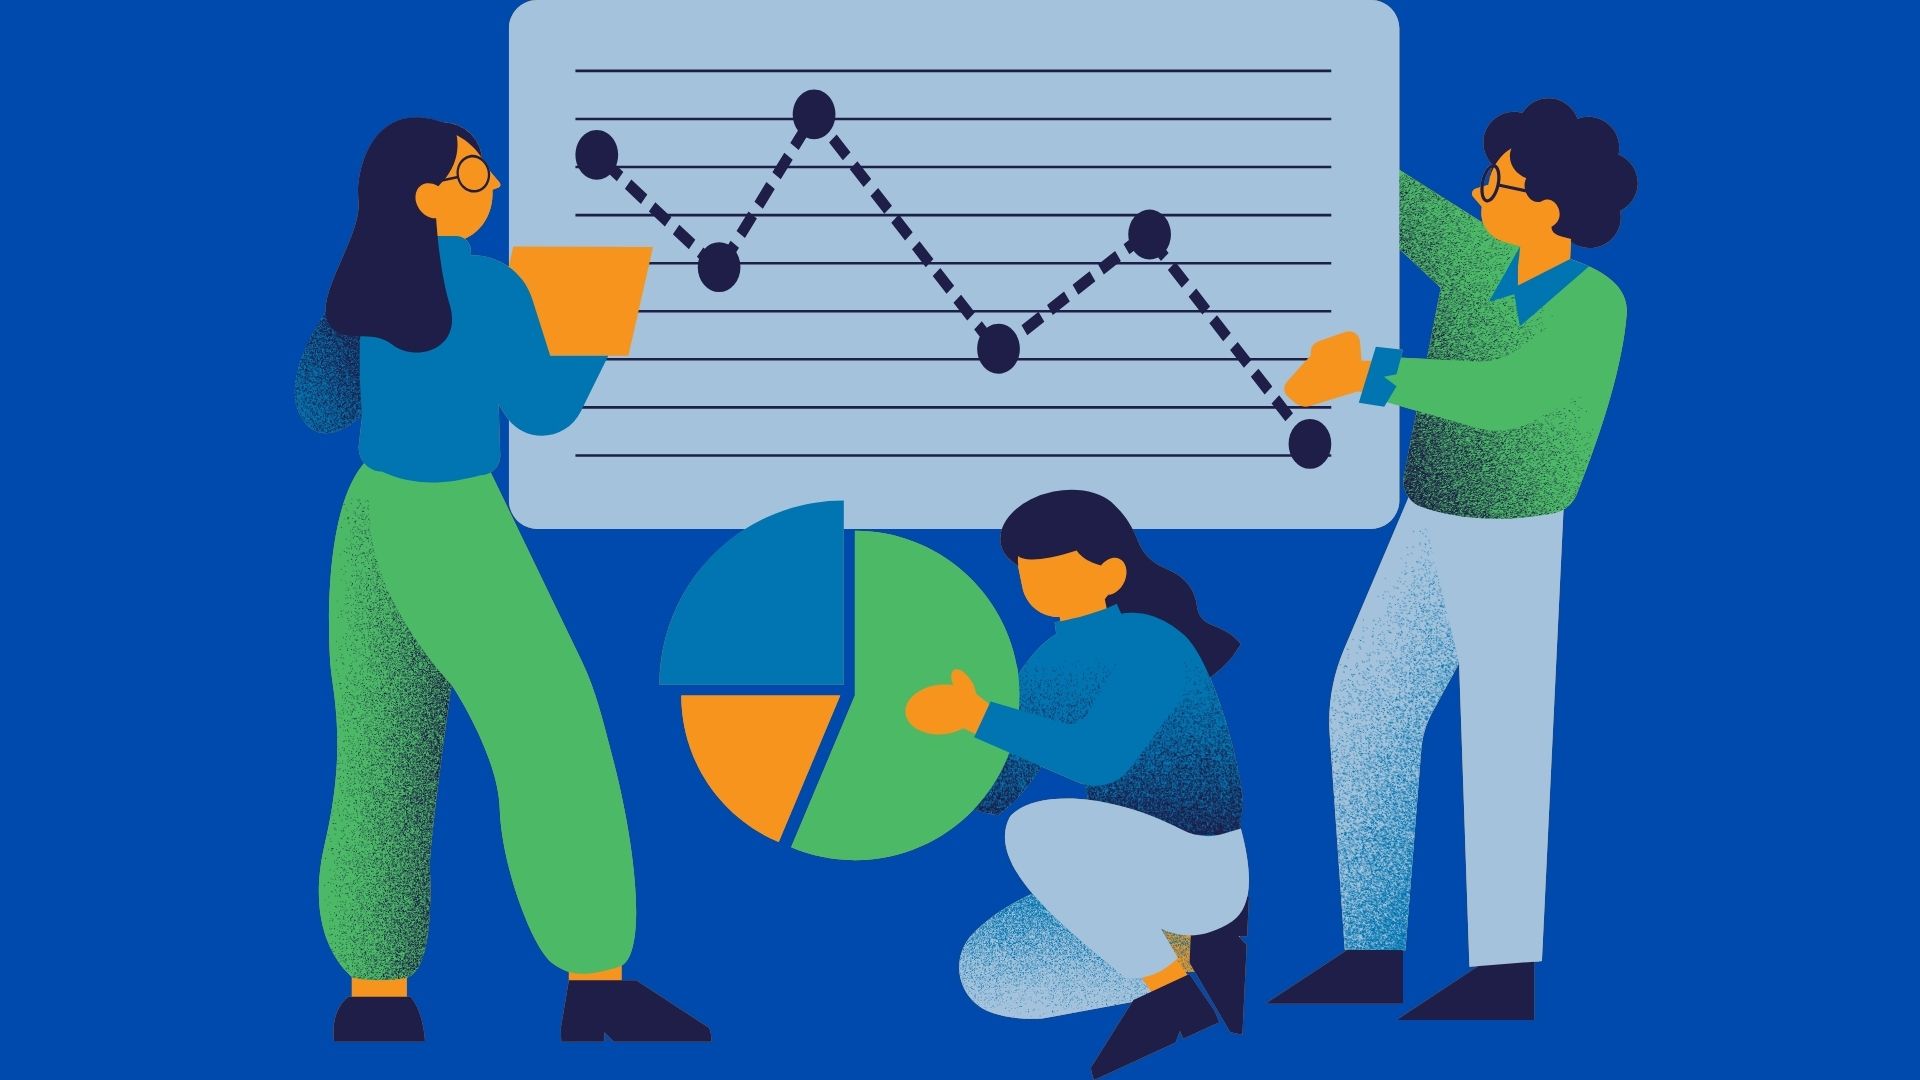
Business environments are increasingly data-intensive, and it is of utmost importance to interpret and analyse data to make prudent business decisions for organisations. It is important for organisations to analyse data to understand trends and operational efficiency and make decisions to improve the organisation’s position and find a competitive advantage in the relevant industry.
While larger amounts of data with more dimensions setting the context make the tools for data management and analysis more specialised, they are the tools that data analysts use to translate and analyse data into business outcomes.
Quick Overview
In today’s data-driven world, organisations must use specialised tools to manage, analyse, and visualise data effectively. This guide explores why data analysis is essential for making informed business decisions, gaining operational efficiency, and staying competitive.
Whether you’re a data analyst or managing business intelligence, this guide walks you through:
✅ Managing and querying data with SQL and data warehousing tools.
✅ Cleaning and preparing data using tools like OpenRefine and Trifacta Wrangler.
✅ Analysing and modelling data using Python, R, and SAS.
✅ Visualising insights with Tableau, Power BI, and QlikView.
✅ Handling big data and building AI models with Spark, TensorFlow, and Scikit-learn.
✅ Collaborating efficiently using Jupyter Notebooks, GitHub, and Slack.
In this blog, we are not going to look into best practices for using every tool to analyse data that data analysts use, but instead give you an overview of what these tools to analyse data for SQL analysts are and what their key features and benefits are.
Given that your data analysis company collects data on crop yields, sales revenue, marketing campaigns, and spending, your role as a data analyst includes sorting through the vast amounts of data to identify patterns, trends, and valuable insights, ultimately advising management on business decisions that can be made to analyse data.
In essence, this involves taking in data, processing it, and conducting statistical analyses such as predicted means and functions to analyse data. In turn, raw numbers are turned into actionable intelligence, allowing your organisation to make informed decisions based on the intelligence.

As a modern business, we are required to analyse data most of the time because it helps us understand our customers and their behaviour, which then helps our operation in terms of time, cost, and quality.
Moreover, this report can also tell us other opportunities out there that can help the company achieve a long-term strategy, which means if you give us the right information to analyse data, you can tell us what is going to happen in the future and tell us what is the best recommendation for us to be competitive in our market. You are shaping the future planning and strategy for our company.
It’s simply not feasible to use simple tools, like spreadsheets, to interpret all this data–in fact, that level of complexity and quantity of data virtually demands that you use true data-handling tools to analyse data, and even then, you’ll want tools suited for the work at hand–perhaps for managing, cleaning, and processing data, or perhaps for actually analysing and interpreting the processed data.
Very often, the data you’ll work with is voluminous, with data of diverse and multiple types coming from various sources: customer transactions, log data, ratings, preferences, demographic data, data from sensor-equipped items (the Internet of Things, or IoT), social media, user feedback, and many more.

And because these dedicated tools do a lot of the repetitive coding for you, they also ensure that you perform higher-quality analyses in a much more efficient way to analyse data. Furthermore, specialised tools to analyse data offer the following benefits: computational power: To analyse datasets that are large can be extremely time-consuming. This means piecing together your elements–something that’s possible with smaller datasets–becomes incredibly difficult, even with access to a fast, private computer.
Analyse datasets that are same with specialised tools, however, and there’s no need to build up the set piece by piece. The tools can analyse datasets that are huge (like Twitter’s chat) in seconds. advanced features: These are not tools designed for hobby use.
The leading tools on the market come loaded with the same advanced data-cleaning, data-transformation, and visualisation features that professional analysts are using to analyse data. There is no need to isolate groups of users in a new ‘microcosm’, as Shakespeare observed during the early days of expansionism. Gentler learning curves: The beauty of specialised tools to analyse data is that your focus can remain on meaning.
Yes, you’ll need some coding knowledge to get started, and, as always, you’ll need to learn the intricacies of the tool and its data sources to analyse data. But once you do, you’ll see that a lot of the repetitive coding work involved to analyse data has already been baked into the tool.
In that way, it’s a tool that will help to streamline your workflow, make fewer mistakes, and provide more reliable results to analyse data. It can free you up to spend less time dealing with technical details and more time interpreting the data with greater precision, resulting in a greater chance of drawing meaningful conclusions to help your business.

SQL (pronounced ‘sequel’) is used by all databases to analyse data. It’s referred to as a Structured Query Language: you query tools versus querying databases. It’s the main, unthinking way of communicating with databases. SQL is the language of interaction that allows you to ask questions of a database. Whenever you’re querying a database, you’re learning SQL. Generally, it’s required to know it well to analyse data. Analytic databases are almost exclusively relational.
Using an SQL database makes sense because it provides a way to store a large amount of structured data in a structured way, providing more power to query it to get specific pieces of data, join data from multiple tables, and use constraints and relations to make sure the data is sound to analyse database.
MySQL is an open-source SQL database to analyse data that is most popular for its performance, reliability, and simple approach to working with it. It can be useful in any web-based application and handles massive operations, which is why lots of businesses use it.
PostgreSQL, the other notable free and ‘rich’/‘enterprise’ SQL database to analyse data, is also well equipped to run complex queries, transactions, and data integrity, so it is suited to mission-critical enterprise applications where reliability and robustness are essential.
Microsoft SQL Server is a full-featured Microsoft SQL database to analyse data that comes with a range of tools to manage large amounts of data in a centralised repository. It enables users to apply analytical capabilities to data and integrates with other Microsoft products. With robust security, the application can be scaled according to an data analysis company’s requirements. SQL Server is primarily used in enterprise-level applications.
Data warehousing is the storage and management of data by pushing it from its sources into a centralised repository. With a data warehouse, you can pull data together, combine it, query it, and report on it from one place and make the best decisions possible.

An example of a fully managed data warehouse and data analysis service is Amazon Redshift (part of AWS); it was designed to store and analyse database in large amount and boast the ability to query large datasets quickly. Redshift is an ideal solution for data analysis company’s striving to deal with big data analytics.
They have a serverless, highly scalable data warehouse and data analysis service called Google BigQuery. It allows customers to use their data to respond to SQL queries at super-fast speeds using BigQuery’s ability to leverage the processing power of Google’s infrastructure. Google BigQuery is especially powerful at processing and moving large-scale volumes of data and integrating with other Google Cloud services.
With Snowflake, you can focus on capturing information in your data warehouse at an extremely high speed and scale, completely independent of how that data is stored and consumed using SQL. Snowflake is a data storage experience built for the cloud. It’s both highly flexible and scalable. Store any data, both structured and semi-structured, and query your data using SQL. Combine your data assets easily to support rich data sharing and collaboration.
In addition, this new cloud data warehouse separates computing and storage, enabling you to scale storage and computing resources independently.
Microsoft Excel is still one of the most multifunctional, effective, and popular programmes that can help users work with information, its organisation, processing, and display. Excel is easy to learn and use, both for beginners and advanced users. It provides capabilities for users to organise and manipulate data and also provides options for graphical representation of data sets.
With it, thousands of different kinds of data can be covered, and similarly, thousands of functions can be made and calculated. With Excel, one can perform simple tasks such as data entry and basic operations, or it can be used in more complex ways, like for pivot tables, data visualisation, and complex statistical analysis.
Another defining feature of Excel is its formulas and functions, which allow users to calculate things, save time by automating repetitive tasks, or conduct quick analysis–for example, to rapidly search for and retrieve a piece of data using the VLOOKUP function, or better summarise a dataset using the AVERAGE, MEDIAN, or STDEV functions, among others.
Excel’s pivot tables are valuable for summarising data; that’s when you use multiple groupings simultaneously for a larger dataset. You can quickly group, filter, and sort data inside your pivot table to help you identify trends and patterns more efficiently across several columns and rows. A pivot table is useful for creating reports to generate insights into your data.
Its features are only a part of Excel’s value; add-ins and integrations with other tools, such as Power Query (for data transformation and cleaning), can extend its usefulness to bring in data from different sources, including SQL databases and web services.
In conclusion, Microsoft Excel is an essential tool to analyse database. It is user-friendly, has sophisticated functions, and allows users to create numerous useful and professional-looking data-related products. Excel offers the flexibility to handle small or huge data sets. With its power and capability, this information analysis software can be utilised to reach your analytic goals.
What It Does: OpenRefine is an open-source tool for data cleaning and transformation, designed to allow people to easily explore large and messy datasets and clean data very quickly. You can fix errors with a single click, update web feeds, find duplicate items, and more. It’s available in a moderately huge number of languages and works with CSV, Excel, JSON, XML, and other formats.
OpenRefine’s ability to work well with messy data is impressive. It highlights mismatches, misspellings, incorrect formats, and the like. It is also good at splitting columns, joining cells, and other powerful data transformation functions using GREL (General Refine Expression Language), a language custom-built for OpenRefine.
Case: data cleaning in mass: OpenRefine is often very useful when it comes to preparing data for analysis. For example, if you have a data set whose entries have discrepancies in the names on them, OpenRefine can cluster the best equivalent entries, perhaps grouping the novel ‘The Hative’ with ‘hative’ and ‘the hative’ in one entry. The differences in nomenclature might be small and unimportant, but it’s still good to have them standardised before you analyse database.
The most frequent use case is dealing with missing data. OpenRefine lets you spot and impute missing values or drop incomplete records, both of which can be vital to minimising the impact of missing values on your dataset and its integrity and, in turn, the quality of your analysis.
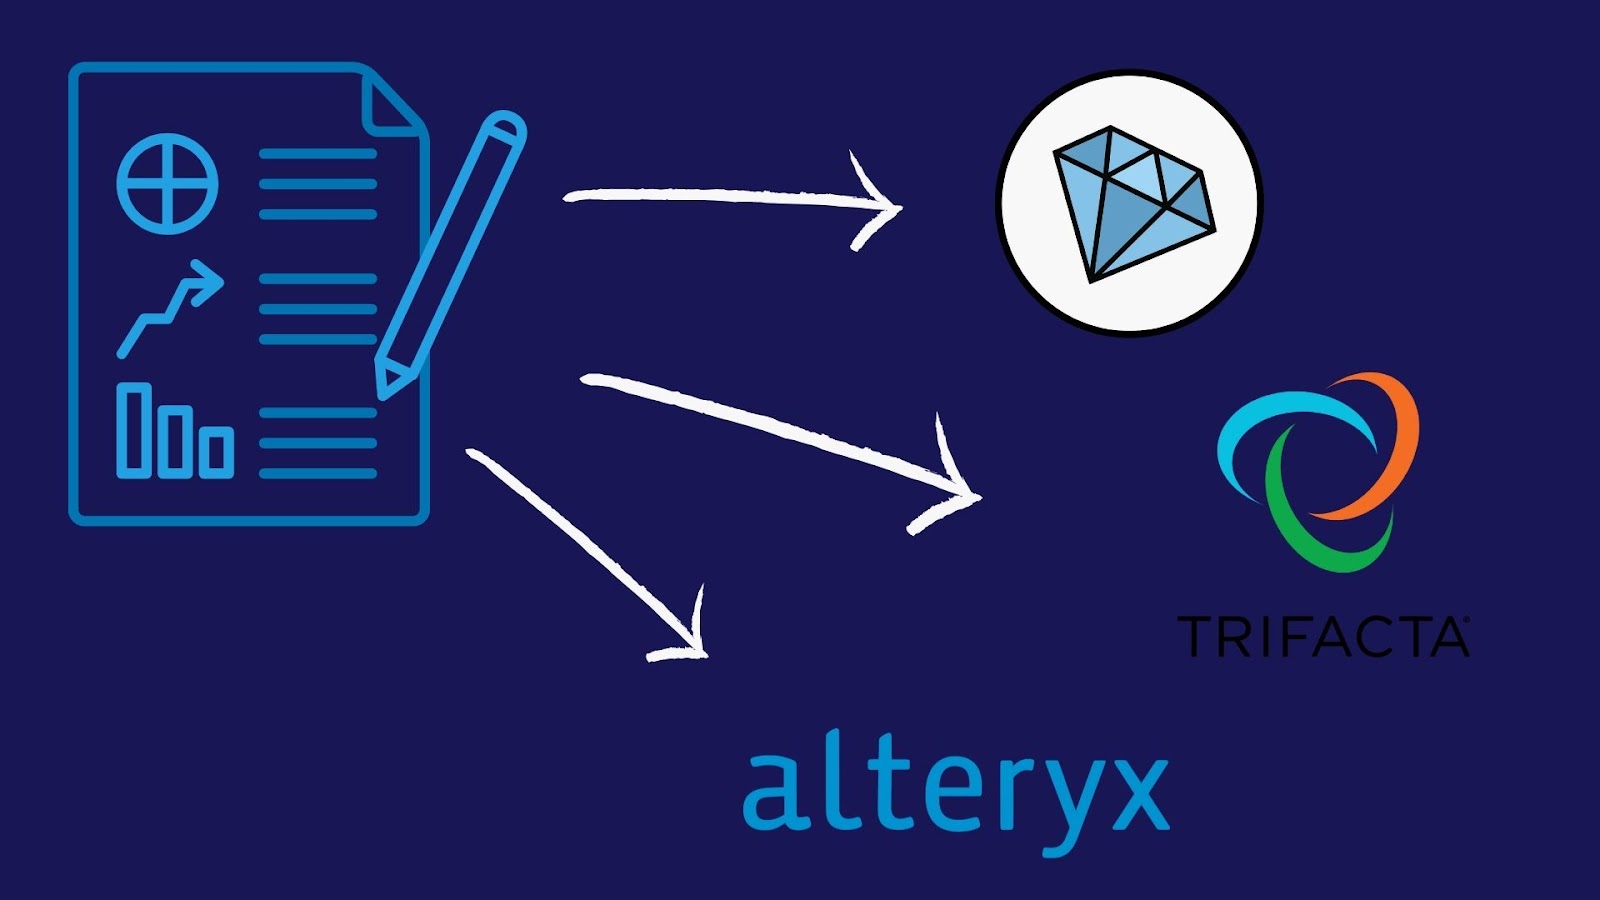
Overview and Features: Trifacta Wrangler is a data preparation and information analysis software that automates the data cleaning and transformation process using machine learning. It offers a click-and-point interface, and users with minimal technical expertise can be up and running with data preparation in four simple steps.
Advanced data profiling features give you great insights into your data quality. You can detect and cure issues in all your data sources with advanced filters, aggregations, and Trifacta’s data wrangler. Great at working with millions of rows of data while staying zippy and responsive.Works with clouds: AWS, Google Cloud, Azure, etc.
Use Cases in Data Preparation: Trifacta Wrangler is well-suited for data preparation for complex analyses and machine learning models to analyse data. If you have a large dataset that needs significant preparation steps (cleaning, joining, adding columns, etc.), then Trifacta Wrangler can offer powerful automation that allows the process to scale to much larger data.
Another application is data enrichment. Trifacta Wrangler enables you to append datasets together from different sources to enrich your dataset with additional data, such as data about customers from third-party sources, to create solid datasets that offer deeper insight and allow for more robust analysis.
Overview: Alteryx is a leading data preparation and analytics platform that offers data blending, advanced analytics, and automation capabilities, including a graphical user interface (GUI) for drag-and-drop data preparation, analysis, and reporting. Alteryx enables data analysts to connect to, combine and analyse data from different data sources, such as databases, cloud platforms, Microsoft Excel spreadsheets, and various web sources.
Main features and functionalities: Alteryx utilises small applications called tools for analysing and configuring data according to user preferences. These tools include customisation options based on resources, users, interfaces, and setups to apply the processing algorithms.
Alteryx supports various methods of exploring and analysing data. For instance, it provides aggregation, recoding, filtering, and statistical tools. In the latter, users can employ exploratory and descriptive approaches to understand and analyse data. These include histograms, box-and-whiskers plots, bivariate scatterplots, and basic calculations of moments and measures. Furthermore, AI and machine learning methods can be employed to understand the relationships between variables in the dataset. Alteryx is a robust and feature-rich platform.
Another strength is that it automates tasks that you would otherwise do repeatedly, providing workflows that automate cleaning, transformation, and analytics of large amounts of data, saving time and work. Alteryx offers advanced analytics, including predictive modelling and spatial analysis, which you can apply to, for example, understand the location of people who have bounced checks or map the most suitable routes between a network of hospitals and disaster zones.
Integration Capabilities and Use Cases: Integrating your data with Alteryx is one of its best strengths. You can pull your data from SQL databases, cloud storage, and even APIs, which enables you to pull data from multiple sources into Alteryx and integrate them as one at the same time. This is a very essential part if you want your entire data to be well represented in one dataset.
Use-wise, Alteryx is best suited to data preparation within larger analytic projects (however, we will be describing its capabilities for data preparation only in this review). For instance, if you are working on a predictive modelling project, Alteryx can help you clean and transform your data by leveraging collection to make it ready for analysis and workflow automation, and it can even help you build and validate the predictive models from the same interface.
Another use case is reporting and visualisation. Alteryx can automatically produce comprehensive reports and dashboards to help you better visualise your data. In this way, you can present your findings to people outside of your data science field and facilitate data-driven decision-making.
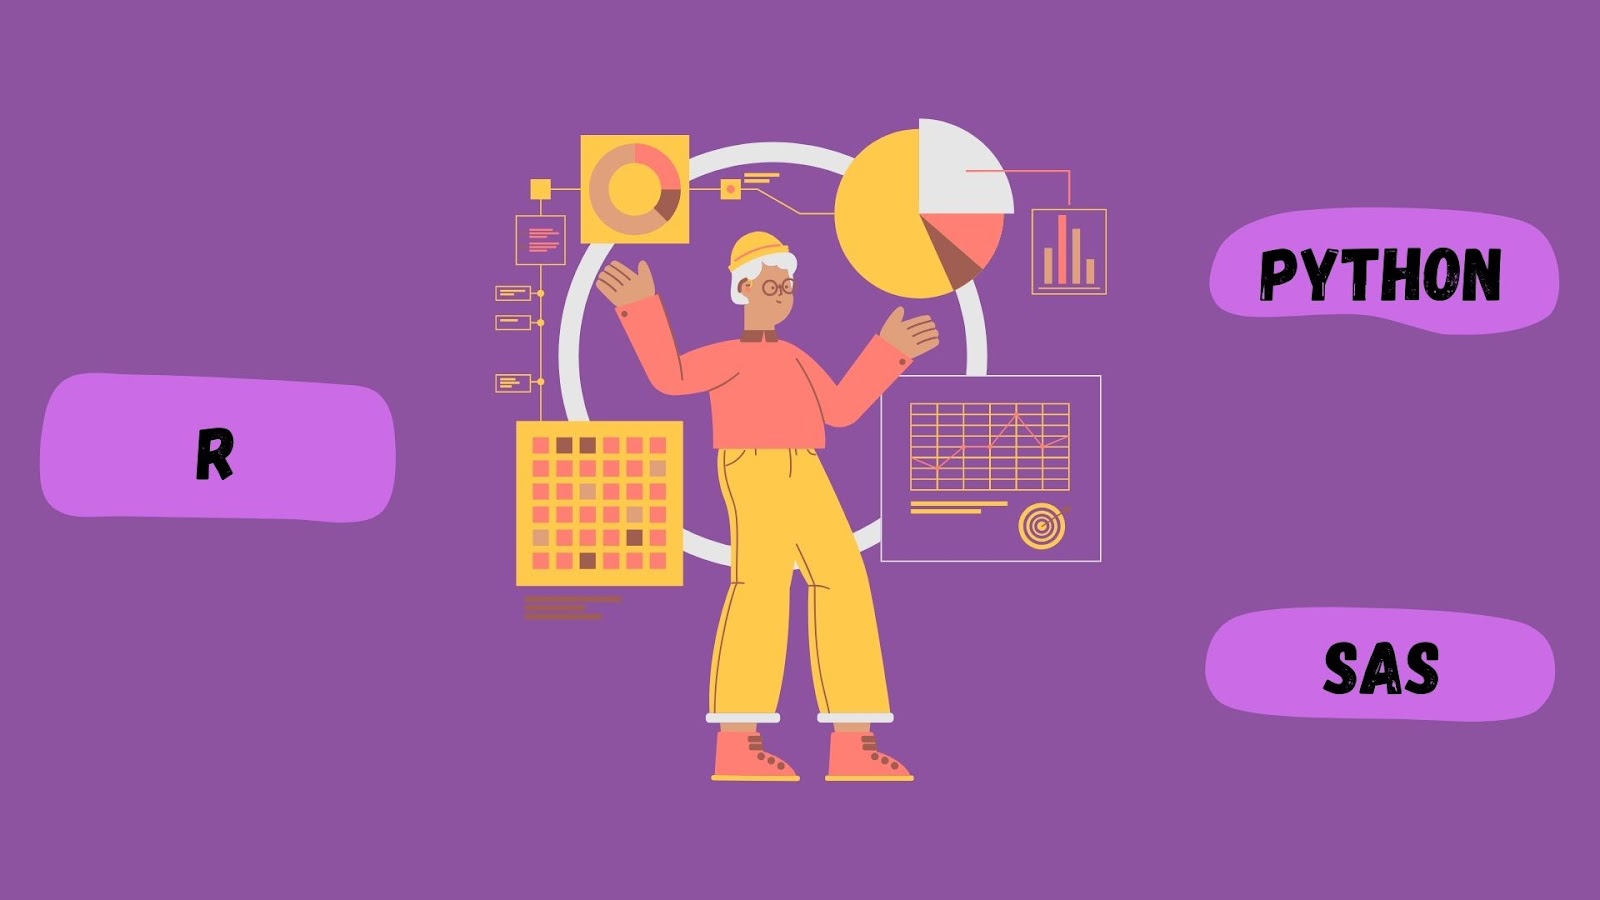
R and What It Can Do for You: R is a language and environment for statistical computing and graphics. It is a GNU project that is similar to the S language and environment that were developed at Bell Laboratories (formerly ATT, now Lucent Technologies) by John Chambers and colleagues. R can be considered a different implementation of S. There are some important differences, but much of the code written for S runs unaltered in R.
R provides a wide variety of statistical (linear and nonlinear modelling, classical statistical tests, time-series analysis, classification, clustering, etc.) and graphical techniques and is highly extensible. The S language is often the vehicle of choice for research in mathematical statistics. R shines at conducting complicated statistical analysis, including a rich set of built-in functions covering statistical tests, linear and nonlinear modelling, time-series analysis, classification, clustering, and more.
Key use cases and packages: A key strength of R is its vibrant and ever-growing ecosystem of packages that extend R’s functionality. There are thousands of packages (as of September 2022, there are 16,093 packages on CRAN, the Comprehensive R Archive Network) that improve R for specific tasks. dplyr is a package that streamlines certain data munging operations; ggplot2 is famous for its powerful data visualisation capabilities; and tidyr makes it easier to tidy up data, making the data less messy and more amenable to analysis.
R has become the language of choice for academics looking to conduct research, thanks to the programme’s capabilities for performing experiments, hypothesis testing, and building analysis on surveys or other data. The business world, too, has embraced R programming, using it for data mining and predictive modelling, and developing rich visualisations to help communicate the results of analyses.
Python for Data Analysis:
Overview: Python is a general-purpose programming language that has gained popularity in recent years because it is easy to learn and read to analyse data. It provides a powerful suite of libraries and frameworks that can be used to explore and analyse data, perform machine learning, and produce dynamic and interactive data visualisations and dashboards.
One strength of Python is its flexibility, and it can be used on various parts of the data analysis stack, from exploring data, checking for missing values, and creating plots (data visualisation), to building machine-learning models that can be used to make predictions.
Python became popular to analyse data because of its considerable libraries. There are many libraries available that are written to satisfy common or specialised analytical needs. Using these libraries means that you are given most of the functionality needed to complete an analysis task, so you can concentrate on the interpretation of the results rather than the time-consuming task of writing functional code from first principles.
Featured Libraries and Use Cases: Pandas, NumPy, SciPy, and Scikit-Learn are the most important Python libraries for data science.
Pandas: It is a must-have library to analyse data and manipulation. Data structures like DataFrames make it easy to work with structured data. Use Pandas to perform operations such as filtering, aggregating, and data joins.
NumPy: NumPy provides the foundation for numerical computing in Python. It includes support for large, n-dimensional arrays and matrices, along with a suite of mathematical functions for operating on these arrays. It’s useful for any mathematical or statistical task.
Scipy: Using NumPy as its core library, SciPy adds functions for more advanced scientific and technical computing, providing modules for optimisation, integration, interpolation, eigenvalues, and so on.
Scikit-Learn: It is a machine learning library in Python that provides a wide range of machine learning algorithms for classification, regression, clustering, and dimensionality reduction for simple and efficient data mining and analysis.
Because of its flexibility, Python is used for so much more than just websites and games. Python is used in business to analyse data, predictive modelling, and automating any task that involves data. In research, tools are built with Python for statistical analysis, simulation, and building machine learning models.
Introduction to the Makeup and Analytical Capability of SAS:
SAS stands for Statistical Analytical System, which is a suite of software packages developed by the SAS Institute to construct an environment that can deal with advanced analytics, business intelligence, data management, and predictive analytics. SAS is super information analysis software with special attention to the security aspect of the data that reads and deals with.
Nowadays, every large or small data analysis company in spheres where data protection and reliability are of huge importance relies on SAS.
SAS has a reputation for excellent data handling, a large collection of statistical procedures, ease of handling huge datasets efficiently, good graphical user interfaces, and a programming language that is conducive to performing many complex statistical analyses and manipulations of data.
Business Use Cases: Everywhere you turn, you can find SAS being used in business for a wide range of analytical purposes. It’s used in banking for risk management, fraud detection, and customer analysis. In finance, it’s used to help people make good data-driven decisions, spot fraudulent behaviour, identify corruption, combat money laundering, analyse data of price trends, and make investment decisions. In nightclubs, it’s used to monitor the vetting and suitability of clubgoers, often via facial recognition software.
Companies in the healthcare sector, including the National Institutes of Health, utilise SAS for clinical trial to analyse data, patient safety monitoring, and health outcomes research. It can process enormous volumes of data and execute complex statistical analyses, making it a valuable tool for medical research and regulatory reporting.
In academia, we’ve used SAS for statistical analysis in areas such as epidemiology, biostatistics, and the social sciences. SAS excels in its statistical functions, its reproducibility of results, and its ability to handle complicated data structures.
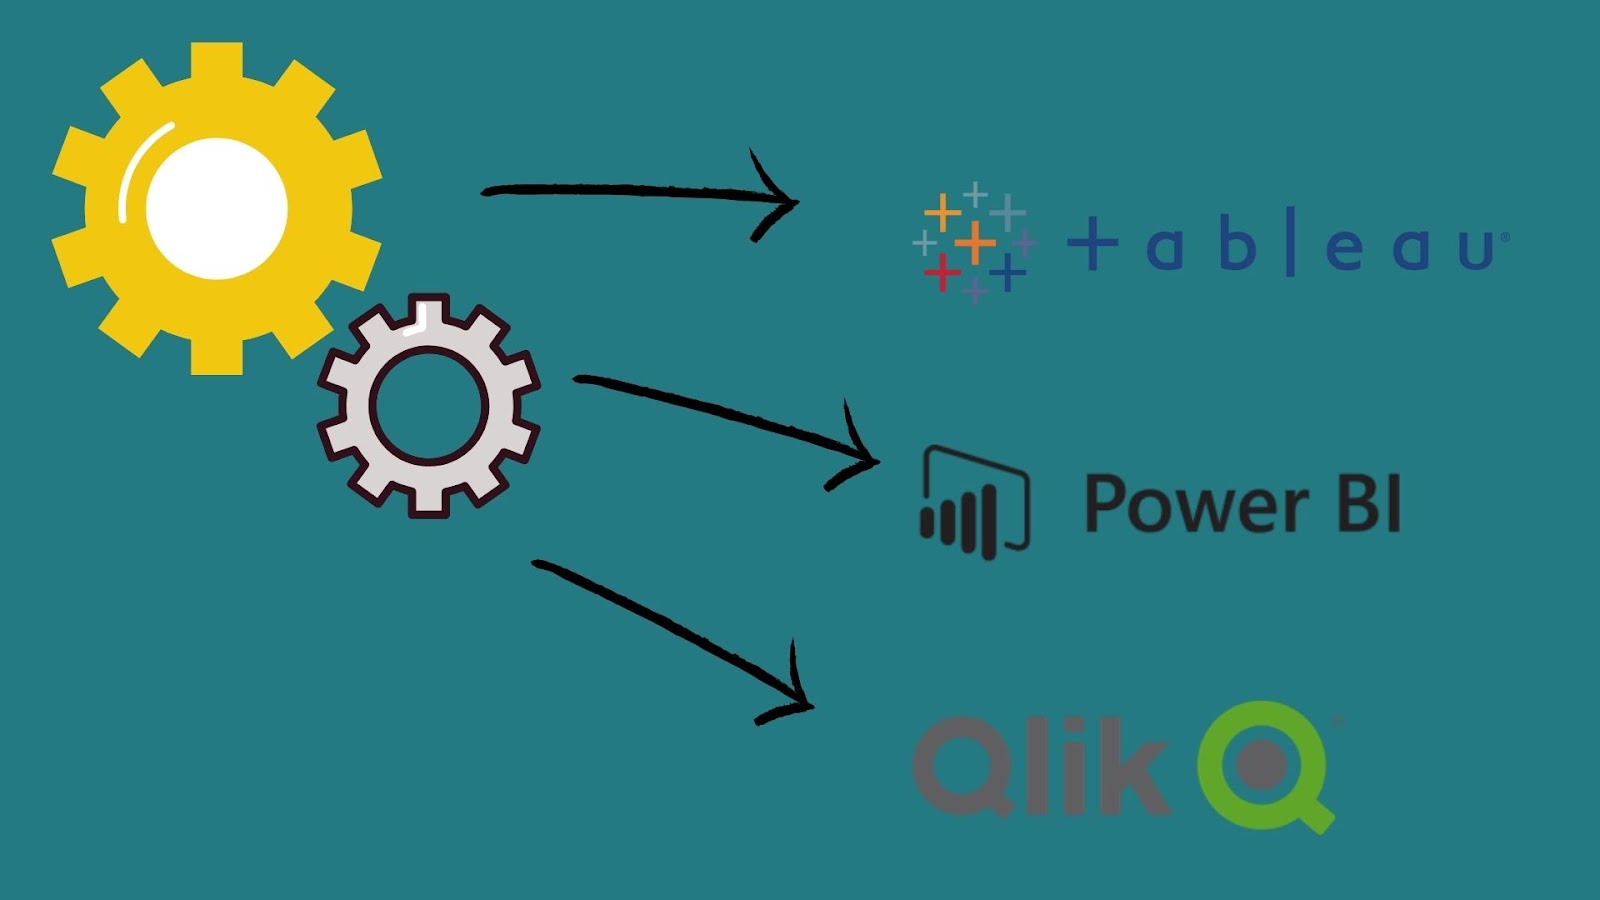
Overview at a Glance: Tableau is a data visualisation and business intelligence analysis software from Tableau Software. It provides users with interactive and shareable dashboards to make to analyse data intuitive, actionable, and accessible. Tableau can be connected to a variety of data in its original format and analysed together to gain insights.
Tableau offers Features and Benefits for Data Visualization: Great visualisations are Tableau’s biggest asset; it offers a tremendous collection of visualisations available out of the box: bar charts, line charts, scatter plots, maps (geographic and age maps), pies, etc. All of them are interactive and drill down into the data for deeper insights.
Tableau’s other selling point is its usability. Provided the user has access to the technical capabilities of Tableau and can make choices about what to display, it provides a no-coding interface for both technical and non-technical users. It is possible to do most advanced analyses in Tableau to analyse data even without opening another application, using calculated fields, parameters, and statistical functions.
In the dashboard feature, you can put as many visualisations as you need in a single sheet and create stories about your data so stakeholders can see a comprehensive view of the insights. Also, we can share the dashboards using Tableau Server or Tableau Online, so all members of our organisation can access the insights.
Power BI is a business analytics service from Microsoft that will convert your data into rich interactive reports and dashboards. You can monitor your business data through Windows desktops and popular browsers, and you can even share your reports on mobile devices. Power BI connects with a wide range of data sources, such as Excel and Azure. This makes it the natural choice for business organisations that are already using any other Microsoft products.
Integration with other Microsoft Tools and Core Features: One of Power BI’s biggest strengths is its integration with the Microsoft stack. This makes it easy to import data from Excel and connect to SQL Server databases. You can also tap into Azure services such as Machine Learning for advanced analytics, as well as literally dozens more Power BI features.
For instance, as part of this drag-and-drop paradigm, Power BI includes a built-in relationship engine that automatically detects correlations as a user sorts and drags tables of data and visualisations onto an interactive workspace. It is possible to develop sophisticated relationships between different datasets without having to explicitly write querying code or commands.
Now, Power BI also features built-in AI functionality, such as the ability to interact with data using natural language processing (NLP). This functionality allows the user to pose queries to the programme in English: ‘Tell me why sales went up in Q3’, and receive as a reply an array of visualisations that represent those answers.
Other benefits of Power BI include the ability to create real-time dashboards that can consume data streams from live sources and make fresh insights available whenever you need them, and collaboration features that enable teams to share reports and dashboards among themselves to focus on what’s needed rather than what’s sent in unwanted email.
Qlikview is a software tool used for data visualisation. It is the company that created the first version of this leading data visualisation tool. The tool uses an associative data model that allows users to view data by taking positions at different angles. It provides a 360-degree view of data, which is more insightful than the conventional classification of data in tables or columns.
Unique Features and Use Cases: QlikView’s in-memory data processing, which processes data in the server’s memory, is one of its most prominent features. With this feature, the data is directly accessible and can be processed in seconds. It is one of the core features of QlikView compared to other BI (business intelligence) and analytics platforms that generate in-memory datasets. Users can perform a large amount of analysis on a large portion of their data in real-time.
One other key advantage is its associative model. Whereas all other tools use a hierarchical model, so you inherit whatever filters are applied higher up the tree in your analysis, with QlikView you are just free to explore, choosing exactly what to select and seeing how it affects other key metrics. One result of the associative model is the ability to spot patterns that other tools would miss.
QlikView is particularly helpful when you are undertaking some exploratory to analyse data. For example, in the retail sector, QlikView might be used to sift through sales data to identify trends and patterns in customer behaviour. A healthcare insurer might use QlikView to analyse data of patients to uncover insights that help deliver better patient care or improve operational efficiency.
It is possible to create a variety of data visualisations in QlikView, such as bar charts, pie charts, scatter plots, and heat maps. This type of data visualisation can then be combined in dashboards to provide, all at once, an easy-to-understand representation of the data available to the stakeholders who need to make decisions.

Apache Hadoop is a distributed computing framework and an open-source software framework written in Java. It is central to managing huge datasets in distributed computing clusters through MapReduce algorithms, which facilitate cost-effectively processing massive datasets in parallel across nodes of a cluster.
Components: HDFS, MapReduce, and YARN: Hadoop is made of some mainstream components to manage and process big data.
HDFS (Hadoop Distributed File System): Hadoop’s storage layer and the block storage system for big data. Large datasets are divided into smaller blocks and distributed to multiple nodes in a cluster. Data redundancy and high availability are ensured for all blocks stored on at least two nodes each.
MapReduce: MapReduce is the processing engine of Hadoop. Simply put, the engine divides the data processing task into many sub-tasks (map functions), which are distributed to and executed in parallel at each node of the distributed environment. All the results are subsequently aggregated and combined to generate the final output (reduced functions). This parallel distributed processing is what makes Hadoop powerful for processing big data.
YARN (Yet Another Resource Negotiator): YARN implements the resource management layer of Hadoop. It allocates and manages resources within a shared cluster across applications, ensuring that there is sufficient computing power to run the jobs on Hadoop affordably and efficiently. Using YARN, multiple data-processing engines can run concurrently on Hadoop, increasing its functionality.
What is Spark?
Apache Spark is a unified analytics engine for large-scale data processing. It is extremely fast, easy to use, and supports sophisticated analytics. Spark can be used for batch processing as well as stream processing. It also serves as a machine learning engine, making it a complete tool to analyse data that are big.
Benefits of Big Data Processing: Spark is beneficial for big data processing to analyse data. It is increasingly popular among data analysts and engineers.
Speed: Spark can process data in memory, which is inherently faster than disc-based processing found in systems such as Hadoop MapReduce. It can be up to 100 times faster for certain applications to analyse data.
Ease of use: The Spark APIs are available in several programming languages, including Java, Scala, Python, and R, so you don’t need to rewrite parts of your analytical code (when transferring, say, from Spark-Python to Spark-Java). Most importantly, you have an interactive shell to do rapid exploration and prototyping.
Deep analytics: Spark has built-in libraries for deep analytics functions like Spark SQL for structured data, MLlib for machine learning, GraphX graphs for processing, and Spark Streaming for real-time processing. Spark organises these libraries so you can conduct complex analyses and produce sophisticated digital data applications.
Scalability: It is engineered for large-scale big data processing and also works when there are as few as two nodes (from the article ‘Apache Spark: Lightning-Fast Cluster Computing’ (2014), by Holden Karau, Andy Konwinski, Patrick Wendell, and Eugene Yan), such as to analyse data for industry or medical research. Spark triples fine-feature computational speed and halves memory use.
From Rob H. Cannings’ archive: photos having an artistic filter applied, taken at the Forest and Bird NZ annual conference 2014, The Mount Maunganui Hotel, on March 22, 2014.
General Description of Databricks: Databricks integrates best-of-breed technologies and machine learning libraries into a Unified Analytics Platform. It was developed by the same founders and creators who invented Apache Spark. It provides an integrated environment for data engineers, data scientists, and machine learning engineers to rapidly collaborate on building and operating production workloads for data science pipelines.
Apache Spark Integration and Use Cases: Databricks is built on top of Apache Spark, providing additional features and better user accessibility to make Spark easier to use. The key features and uses of Databricks are:
Collaborative workspace: Databricks enables users to work collaboratively by sharing a single workspace where data engineers, data scientists, and analysts can work together and share resources, libraries, operational notebooks, and distribution sales data. It allows data engineers to share their work while data scientists experiment and develop models to analyse data, and analysts can build dashboards for business discussions ranging from operations to finance.
Interactive notebooks allow engineers to code, discuss, visualise, and share results with others using the SQL, PySpark, R, and Scala programming languages.
Managed Spark Environment: With Databricks, the underlying Spark infrastructure is managed by us, meaning users are not faced with cluster management, underlying resource input, or optimisation. This allows users to focus on analysing data or writing applications while we deal with the infrastructure necessary.
Integration with Data Sources: Databricks works with a variety of data sources, such as cloud storage and data analysis services, including Amazon S3, Azure Blob Storage, and Google Cloud Storage, as well as data warehouses, including Redshift and BigQuery, that in turn enable easy data ingestion and processing of unified data across systems.
Machine Learning and AI: Databricks provides deep machine learning technologies through MLflow integration, which is an open-source platform for the machine learning lifecycle, including model training, tuning, deployment, serialisation, experimentation, and reproducibility. MLflow also helps integrate Databricks with popular machine learning frameworks such as TensorFlow, PyTorch, and XGBoost for modelling and deployment at scale.
Real-time data processing: Databricks employs Spark Streaming and Structured Streaming for real-time data processing. This enables the data analysis company to process streaming data in real time, such as data received from IoT devices, log files, and social media feeds, so they can gain insights instantly and make prompt decisions.

TensorFlow: TensorFlow is an open-source machine learning framework created by Google. It allows developers to create machine learning models by providing them with the tools to build models, train them, and serve them. TensorFlow enables developers to build, train, and serve machine learning and deep learning models on multiple interfaces.
These models are written using dataflow graphs, which can be used with high-level APIs like Python or Keras or compiled into efficient C++ programmes for deployment. It is very adaptable to various machine-learning and deep-learning algorithms. TensorFlow is great for research and production.
Machine Learning and Deep Learning Use Cases: Because of its unprecedented scalability and flexibility, TensorFlow is used for a wide range of applications across industries. Some of the key use cases that leverage TensorFlow include:
Image Recognition: TensorFlow can be used to recognise objects in images, faces, medical images, et cetera. For these tasks, a powerful tool in our arsenal is convolutional neural networks (CNNs), so-called because they process inputs using a series of filters, like putting a filter over a window and moving that window across the image.
Natural Language Processing (NLP): TensorFlow provides tools for developing applications like sentiment analysis, machine translation, and chatbots. It supports transformers and recurrent neural networks (RNNs), built with TensorFlow, that can be utilised in complex language models, generating text that mimics human output.
Predictive Analytics: Many businesses use TensorFlow to build predictive models such as forecasting sales or customer behaviour or catching fraud using large datasets and complex models.
Reinforcement Learning: TensorFlow is also used for reinforcement learning, where models learn to make decisions by interacting with the world around them. This is useful for self-driving cars, robotics, and playing video games.
Keras is an open-source, high-level neural network library written in Python with Pythonic core APIs. It facilitates rapid prototyping, helps in handling preprocessing, and offers an easy modular API structure for deep learning models. It is easily extensible and portable to other frameworks such as TensorFlow, Theano, or CNTK.
Keras Integration with TensorFlow Inception v3 (try it on your photo) and the split glass ✔ Use Cases Keras is tightly coupled with TensorFlow; it’s the project’s unofficial (as of today) “high-level API.” This coupling means that users can essentially get the best of both worlds, hosting a Keras model inside TensorFlow and taking advantage of its massively parallelized implementation while getting a straightforward interface. Some common use cases include:
Working with Keras: One advantage Keras has over other frameworks is that it’s particularly suited to quickly prototyping or experimenting with architectures; the syntax is very simple to work with, and the fact that it’s built on modules means that it’s quite easy to create and test models using very little code.
Image Classification: Like TensorFlow, Keras is used for image classification tasks. Because Keras has built-in layers and pre-trained models (such as VGG16 and ResNet), users can quickly achieve good results for image classification problems.
A famous library called Keras is quite easy to use; it can work for NLP tasks such as text classification, sentiment analysis, and sequence-to-sequence models. It is very easy and simple; you can build your model and data in training.
Time Series Forecasting: Keras can be used for time series forecasting, which includes predicting future values based on past data points, thanks to its backward compatibility with Theano. Time series forecasting is particularly suited to LSTM (Long Short-Term Memory) networks in Keras.
Summary of scikit-learn: scikit-learn is an open-source machine learning library for the programming language Python. The library is simple and effective: it provides various tools for data mining and to analyse data; scikit-learn is launched on top of NumPy, SciPy, and Matplotlib, which makes it suitable for many machine learning tasks.
Features and Use Cases: scikit-learn’s features are geared towards numerous types of machine learning: linear and logistic regression, support vector machines, clustering, discriminant analysis, dimensionality reduction, model selection, and preprocessing (modifying numerical data to improve learning accuracy).
Classification: As an example of a task, scikit-learn has a large number of classification algorithms, including support vector machines (SVM), k-nearest neighbours (KNN), and decision trees, which are used for tasks such as spam classification, image recognition, and medical diagnosis.
Regression: for linear regression, polynomial regression, and other techniques for predicting continuous outcomes such as prices for houses, stocks, and sales forecasting.
Clustering: Algorithms for clustering will label examples or objects into groups (so-called clusters) that appear to be particularly similar to each other. scikit-learn provides k-means, hierarchical clustering, and DBSCAN clustering algorithms and has a variety of data-science applications, such as customer segmentation, market research, and image compression, to name just a few.
Dimensionality reduction: It reduces the dimensionality of your dataset. Techniques such as principal component analysis (PCA) and singular value decomposition (SVD) are implemented in scikit-learn. Dimension reduction is useful when visualising high-dimensional data, for example, and also helps improve the performance of your machine learning model.
Model Selection and Evaluation: There are tools such as cross-validation and grid search for model selection to check how well a model works, plus metrics for evaluating model performance. More specifically, tools are available to make sure that models are robust and valid.
Preprocessing: The library has several preprocessing utilities, like standardisation, normalisation, and one-hot encoding of categorical variables. Accurate preprocessing of the data is important before feeding the model for supervised learning purposes.
It has been able to survive this success and continue to be one of the most relevant machine learning packages in academics and industry because it is relatively simple and easy to use, computationally efficient, and comes as a versatile, ready-made package of tools for a spectrum of applications, from basic data exploration to production machine learning applications.
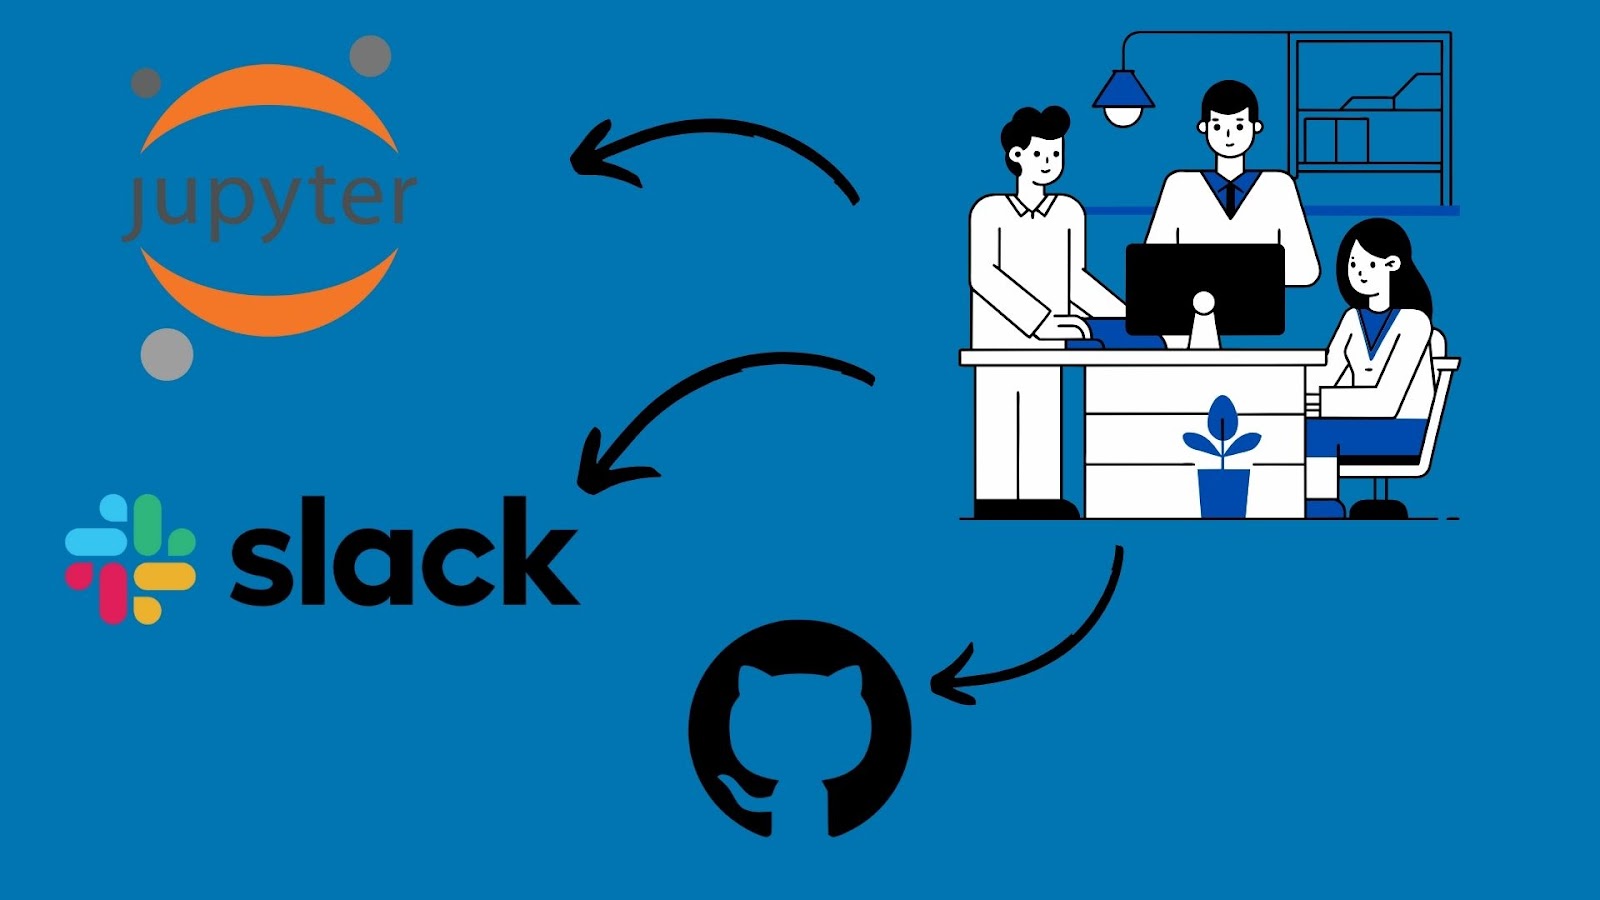
Jupyter Notebooks is an interactive, web-based tool for creating and sharing materials, including code, narrative text, equations, and visualisations. Jupyter Notebooks is open-source software that supports many languages (including Python, R, and Julia) and is particularly popular for data science and analytics. It’s very flexible, permitting everything from light-hearted games to complex multimedia genres.
Use cases: Jupyter Notebook is a great tool to analyse data, in which you write and execute code line by line; it’s particularly helpful for iterating on hypotheses, testing models, and visualising data.
For collaboration, Jupyter Notebooks are well-suited for preparing and sharing work by teams of data scientists and analysts. They can easily create rich, interactive reports with code, outputs, and visualisations that can serve to fully document the analysis and enable others to replicate it. [the_ad id=’13702′] Sharing Jupyter Notebooks on software platforms such as GitHub or JupyterHub is done easily, which makes it well-suited for collaboration and version control.
What is GitHub?
GitHub is a web-based version control and collaborative code development platform that provides version control and source code management using Git. Githiub’s version control system is called Git, a distributed version control and source code management system. Git is a command line or text-based tool that is used for tracking changes in source code during a software project.
GitHub helps both teams and individuals work together on software projects by introducing a version control and source code management system called Git. Git was first released in 2005 and is written and maintained by Linus Torvalds.
Version Control and Collaboration: For datawork, version control is likely a critical aspect, and using GitHub is an opportunity to work with code and analyse data scripts in a version-controlled setting. If you open up a GitHub repo, you’ll see lots of files and words like HEAD, master, pull request, forking, and more. Notably, GitHub has some relatively easy tutorials, such as contributing to open-source projects, collaborating with colleagues, reviewing GitHub repos, making changes to projects, or learning Git.
GitHub allows several team members to work on the same project at the same time. Pull requests and code reviews enable the collaborative development of projects. That is, team members can submit an update to a project, referencing several lines of changed code that they would like other team members to review. Each team member then has the opportunity to provide feedback on the proposed update before it is merged into the main project. This way, projects can be developed and updated by different experts while retaining the same level of quality.
GitHub offers project management features to allow teams to coordinate more effectively, such as tracking issues, assigning tasks and projects to individuals, and building project boards. All these additional features help to provide greater transparency and allow users to coordinate with teams to deliver promptly.
Slack provides team members with a channel to collaborate and communicate in a streamlined manner. Data teams at Buffer are a mixed bag of remote workers spread across different cities, countries, and even continents. Having discussions over channels enables us to keep everyone in the loop without clogging their inboxes. Slack supports link to data software for faster and easier integration with multiple services. We can also keep messages and ideas flowing at a rapid pace, quickly addressing any inquiries.
Thanks to Slack’s user interface, it allows us to keep an eye on the pulse of our data and share valuable insights with team members. The tool has single-handedly enhanced our team communication and workflow processes.
Communication and Collaboration Features for Data Teams: Slack takes organisation to another level by allowing teams to segregate conversations with channels. Channels can be created for discussion about specific projects, teams, or simply a common topic. Depending on the situation, a single channel might be useful for collaborating on a project, while a structured collection of channels might be suitable.
Channels and channel collections help you organise your collaborations and segregate information so they won’t clutter each other and prevent federated information overflow.
Slack makes it easy to communicate one-on-one or in groups with direct messages and channels. It’s great for coordinating, debugging, and pulling together an ad hoc decision, especially when you need to move fast. You can even create groups that span multiple projects. Slack uses ‘apps’, which are widgets you can integrate with other systems; you can quickly set up integrations with tools like GitHub, Jupyter Notebooks, and Google Drive, bringing everything you need into one place.
Files, code snippets, or data files can be uploaded and shared with teammates with just a couple of clicks from the Slack window itself. Everything uploaded to the channel appears in the main window, which helps team members easily find and refer back to important materials as the discussion continues.
Slack itself provides you with reminders, to-do lists, and other tools, as well as integrations with other team organisation tools such as project management systems Trello and Asana.
Here is a list of tools used by a typical data analyst to analyse data, from working with SQL databases and data warehousing solutions to Microsoft Excel; from using tools for cleaning data, running analyses, and preparing data visualisation to scaling support for big data. Machine learning tools and collaboration tools.
Since the field of tools to analyse data is ever-evolving, you should make sure you keep up with their development to be able to master them, and using them ensures that you are efficient, maximise the quality of the analysis, and ensure that the output is the best it can be for your organisation. With this technology, you are positioned to succeed.